After monitoring enterprise SQL Server instances for over 10 years now, there are 5 tools that are used every day for spot check views of a system. The order here is not a countdown from 5 to 1. They are presented here in no particular order, because each has its own area where it is number one. Over the years, those around me have gain more understanding of a SQL Server instance and fine tuning that is needed to optimize the usage of these tools. Though most are free, there is a cost in performance on using these assistants and you better have a good understanding of their output.
Performance Dashboard
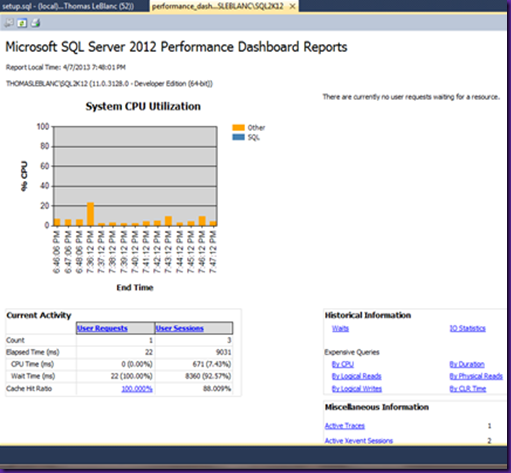
This feature was added in SQL Server 2005, but has versions available for 2008 and 2012. The 2008 version is actually the 2005 version with a modification to the script. It is a central location from Management Studio to view what is going on in the last 15 minutes plus drill-thru reports for current OS and SQL statistics along with historical statistics. The dashboard is divided into 4 areas – CPU Utilization, Current Waits, Current Activity and Historical/Miscellaneous Information. The links on the dashboard provided in each area drill into reports (rdl files) that get statistics from DMOs (Dynamic Management Objects) which are DMFs and DMVs you might be familiar with.
The top-left quadrant is for CPU Utilization. The blue part of the percentage bar is the amount of CPU used from SQL Server process, while the rest is outside of SQL Server CPU usage – Windows OS and other applications. Clicking the blue part of the CPU bar will show current running queries ordered by CPU usage. This is convenient information about was is taking up SQL CPU time at the current time. The Current Waits section lists the waits categorized by type with drill-thru capabilities to see the queries with waits. Blocking is one common wait I see. The lower left Current Activity table lets you see the requests happening along with all current connections from the User Sessions link. The 4th section has links to more historical statistics like IO by database files, Waits summed up by category, along with reports about queries sorted by Reads, Writes, CPU, Duration and more. The database IO usage can help with SAN Administrators.
SP_WhoIsActive
Adam Machanic has done a great job with this tool, and it is suggested to go visit the 29 days of SP_WhoIsActive to really understand what he has done. I would take my time reading his blogs and definitely let each day sink in before going to the next post. This tool gives the user the ability to see what is running with all kinds of statistics like CPU, reads, writes and the list goes on and on. I have 2 short cut keys in Management Studio (SSMS) with 2 different versions: one has the Query Plan in a column and the other does not. I also filter out some logins (sa) and databases (master & msdb).
Ctrl-6 – no Query Plan and some filtering
Ctrl-7 – include Query Plan with different filtering
The filter assists with clearing the noise of executing queries from certain applications. Being able to drill into the query plan from the selected query is great because you can see the execution plan in SSMS.
NOTE: SP_Who3
I have to say I still use sp_Who3 ‘Active’ first before going to SP_WhoIsActive. I remember first using this in SQL Server 2000, but Denny Cherry might have created it before then. The query uses DBCC InputBuffer to get the actual SQL statement that is associated with the SPID of concern which is not available in some cases with DMOs.
Built-In Reports
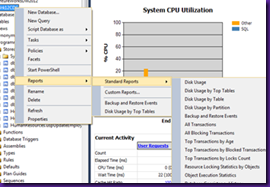
Back to Microsoft and the ability to use reports right from Management Studio. My favorite is Disk Usage and Disk Usage by Top Tables. Right-clicking on a database, then selecting Reports/Standard Reports/Disk Usage from the context menu gives a summary of the database data and log files. You can see how full these files are and space free. If the files have expanded recently, you can expand the amounts and time it took. We recently used this to see a new Distribution database for replication was expanding at 1MB but 507 times each minute which showed up as IO Wait.
I really like the Schema Change and backup and Restore Events, but as you can see below there are many to help with exploring a instances and its databases.
PlanExplorer
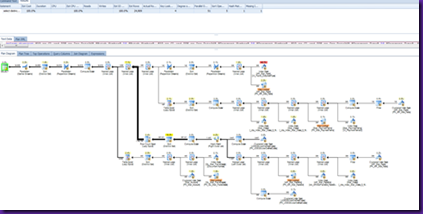
PlanExplorer is a tool to view Query/Execution Plans. This tool integrates into Management Studio (SSMS) so it can be launch from viewing a query plan, maybe after using SP_WhoIsActive. The ability to sort by different columns of statistics from the plan is great. It also compresses the graphical display for easier reading. Highlights with various colors indicate the high object usage percentages so you can drill to the iterators that are the heavy hitters. See below for a view (Fit to Screen) in SSMS followed by the PlanExplorer view.
SSMS
PlanExplorer
Should not be hard to see the difference this tools makes with viewing execution plans.
Profiler
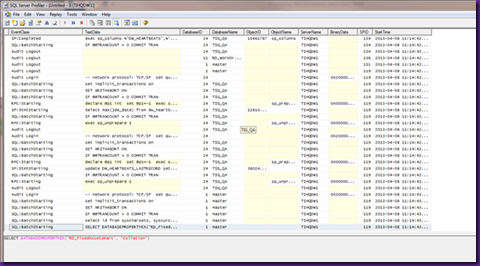
Even though Extended Events will be replacing Profiler in a few versions, Profiler is still being used every day around the world. Once you master the events to trap and columns to view, this tool becomes a great way to see what is going on. Profiler enables you to save templates once you get the columns and events setup that you like. Recalling these templates helps quickly start a profiler trace.
Caution should be notes here that profiler can cause performance problems on systems that are used heavily. I once frozen a production system that had 16 processors and 128GB of RAM by creating a client profile and trying to save the Query Plan event on a production system. The boss was not happy. This is where I learned you can script the Profile trace out and use as a Server-Side trace, saving the trace to a file to be read later. We also removed capturing the Query Plan which I do not suggest using in a trace.


Thanks, Thomas. I'm new to SQL Server DBA and this is informative.
ReplyDeleteThanks for reading my bog.
DeleteGreat post! Perfect level of detail. Enough but not too much.
ReplyDeleteThanks Mr Z
Delete