I heard a preacher say this in a sermon, and thought about ‘issues’ on our servers. Rather than just complain about developers, I decided to tackling the queries my self. So, here is a list of the ones I dealt with in the past month or 2. please enjoy.
CXPACKET is not the problem
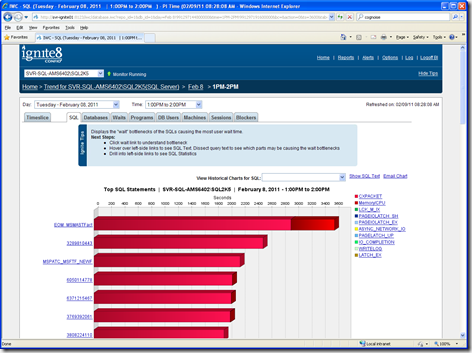
I found a query in our month end process that had a lot of CXPACKETS. This was discovered through Ignite8 from Confio. This tool brings to the top of the heap, the most costly queries based on waits. I can also just look at a day, like end of moth, or even a database among other slice and dice capabilities.
I took the query and placed it in SSMS, and did a Display Estimated Query Plan and got an index suggestion that would improve performance 99%. It was the Sub-Query columns, PatNo + LocationCode with Include Column ClaimDate. The new index took about 15 minutes to create on a 48 million row table, but the Cost went from 3300+ to <5. WOW!!! From a 3-4 hour data retrieval to ~1 hour and no more parallelism.
Thanks again Confio!!!
Bad SQL
Over the last 6 months in the BI group, I have discovered some SQL that turned bad after more and more rows accumulate in the tables that are queried. The problem with the query is that the function has to be performed on ever row.
Taking these trims out, which were not needed because it was populating a staging table, then comparing to the Fact table, reduced the TempDB usage tremendously. If you look at the SET STATISTICS IO ON values below, you can see the before and after effects.
WHERE LTrim(TRim(column) = LTrim(RTrim(column)
WORKTABLE used
Table 'Worktable'. Scan count 1929907, logical reads 33462081, physical reads 0, read-ahead reads 0, lob logical reads 0, lob physical reads 0, lob read-ahead reads 0.
Table 'Worktable'. Scan count 0, logical reads 0, physical reads 0, read-ahead reads 0, lob logical reads 0, lob physical reads 0, lob read-ahead reads 0.
Table 'AUDIT_STAGING'. Scan count 10, logical reads 193381, physical reads 161, read-ahead reads 26709, lob logical reads 0, lob physical reads 0, lob read-ahead reads 0.
Table 'AUDIT'. Scan count 6, logical reads 85351, physical reads 20, read-ahead reads 82695, lob logical reads 0, lob physical reads 0, lob read-ahead reads 0.
WHERE column = column
Removed RTrim(LTrim())
(4622 row(s) affected)
Table 'AUDIT_STAGING'. Scan count 2, logical reads 188552, physical reads 0, read-ahead reads 0, lob logical reads 0, lob physical reads 0, lob read-ahead reads 0.
Table 'AUDIT'. Scan count 2, logical reads 145602, physical reads 0, read-ahead reads 0, lob logical reads 0, lob physical reads 0, lob read-ahead reads 0.
The ‘Worktable’ was being created in TempDB, thus slowing down the query. Amazing what some investigation can do
Answer To SQLSaturday #57 Question
Hash and non-hash Aggregate Streams – Someone in the session Execution Plan Basics asked me what was the difference between these two, and I did not have an answer. Rather than trying to make something up, I told the person I did not know, explained how many different new Execution Plan objects I see all the time, and said I would find out. The SQL Community is amazing!!!
Well, Craig Freedman’s blog answers this question.
Here is a quote from him:
“Stream aggregate is great for scalar aggregates and for aggregations where we have an index to provide a sort order on the group by column(s) or where we need to sort anyhow (e.g., due to an order by clause).
The other aggregation operator, hash aggregate, is similar to hash join. It does not require (or preserve) sort order, requires memory, and is blocking (i.e., it does not produce any results until it has consumed its entire input). Hash aggregate excels at efficiently aggregating very large data sets.”
God Bless,
Thomas


No comments:
Post a Comment