The most popular post on this blog ranked by hits is one about the CXACKET wait stat. There are no comments, so I am not even sure if it was helpful to anyone, but me.
This post will be an example of a query from the AdventureWorks database that runs in parallel by defaults instance settings for SQL Server, but will step you thru changing the thresholds to see differences in query plans when changing these settings. Parallel queries is what ‘can’ cause CXPACKET waits.
First, the query:
SELECT sod.SalesOrderID, sod.OrderQty,
p.ProductID, p.Name
FROM Production.Product p
INNER MERGE JOIN Sales.SalesOrderDetail sod
ON sod.ProductID = p.ProductID
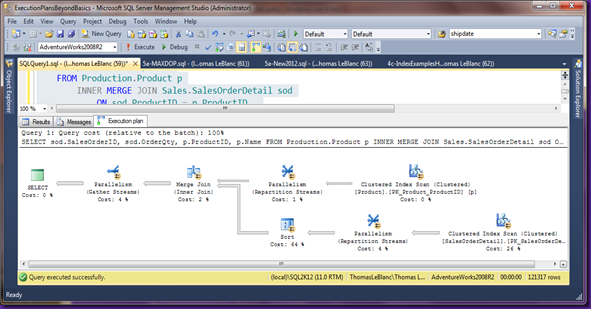
This code uses a query hint, MERGE, to force a certain query plan:
You will see the black arrows in a yellow background indicating iterators running in parallel. For a query to be considered for parallelism, the overall cost of the pre-parallel query must be above the Cost Threshold for Parallelism instance setting. Here is a graphical view from the Object Explorer in Management Studio looking at the properties of the Instance. In this case, the default installation had 5 as the value.
The 2 setting will be looking at are Cost Threshold for Parallelism and Max Degree of Parallelism. These values can be obtained from the sp_configure system stored procedure if the “Show Advanced Option” is on. Here is the code for this:
EXEC sp_configure 'show advanced option', '1';
RECONFIGURE;
EXEC sp_configure;
Now, we are going to use another hint to remove running the query in parallel, OPTION (MAXDOP 1) to find the cost before running parallel.
SELECT sod.SalesOrderID, sod.OrderQty,
p.ProductID, p.Name
FROM Production.Product p
INNER MERGE JOIN Sales.SalesOrderDetail sod
ON sod.ProductID = p.ProductID
OPTION (MAXDOP 1)
By doing this, we can see the cost associated with a non-parallel query plan for this query:
The Estimated Subtree Cost of this query is 10.7496, which is greater than the Cost Threshold for Parallelism (5) on this instance, thus the optimization engine can see if running parallel will help. Here is the cost after running parallel.
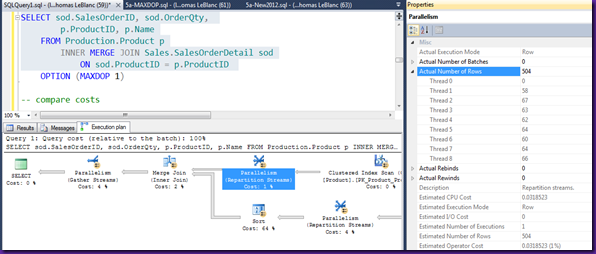
So, by running in parallel, the cost is 1/3 the original query. The other factor in parallel queries is the number of scheduler/threads or CPUs used to run the query. If we look at the properties of one of the iterators for a parallel process, we can find the number it used.
Here, we can see the iterator Parallelism (Repartition Streams) used 8 threads, which is the number of processors on this machine, to run the query in parallel.
If we change the MAXDOP in the query or instance, we can change the number of threads and cost. Below is a script to change the instance level setting from 0 (all processors) to 2.
EXEC sys.sp_configure N'max degree of parallelism', N'2'
GO
RECONFIGURE WITH OVERRIDE
GO
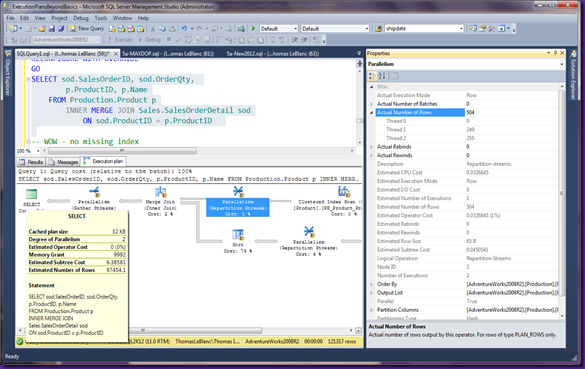
All running the query again, here are the results.
The cost is now 6.38581 and only 2 threads. This shows us that parallelism and the number of threads makes a difference in the cost of the query and how fast it might complete. The Max Degree of Parallelism is a setting that can be changed on the instance as well as using a query hint to control parallelism.
There are good articles on MAXDOP settings on SQLSkills.com that can help explain the changes you might make on the instance level settings.
Thomas


Great article Thomas. I was just about to write one up myself.
ReplyDeleteThanks John, see ya Thursday for some more Execution Plans
ReplyDeleteThomas
Thanks Thomas! Very nice and informative article!
ReplyDeleteThanks for the comments, Nitin.
ReplyDeleteThomas
Great post Thomas! Gave me all the information I need.
ReplyDeleteDoug, you are welcome. Thanks for the comments.
ReplyDelete